


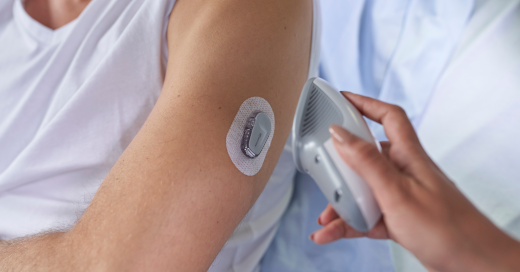
Glucose measurements are crucial for good glycaemic control in persons with diabetes. Besides self-monitoring of blood glucose (SMBG) with a few glucose measurements per day, nowadays continuous glucose monitoring (CGM) is a widespread technique that entails automated glucose measurements every 5 to 15 minutes. The continuous measurements identify glucose trends and alarms can be automatically triggered in critical situations. However, CGM generates a large amount of glucose data, which has to be interpreted correctly to get the best benefit for the patient. One powerful approach is the introduction of some meaningful metrics, which reduces the large amount of data to a few parameters per day.
Many different parameters were introduced to describe CGM results. Some of them are very intuitive, others very mathematical. To limit the number of parameters and to select the most valuable ones for patients, some consensus statements have been published in order to define the use of certain CGM metrics [1] and show clinical relevance of metric targets [2]. The following is a brief summary of the most important key metrics that have been identified in the consensus statements. Targets of the CGM metrics differ between diabetes types and among diabetes risks. In this blog, only the recommendations for type 1 or type 2 diabetes without further risks are summarized. The consensus statements contain more details for any kind of diabetes.
CGM Metrics
Some of the CGM metrics are trivial, other need more explanation as some assumptions are made for calculation. Each calculation of the described metrics is based on a 14-day horizon of CGM data.
The parameters ‘number of days CGM worn’ and ‘percentage of time CGM is active’ are easy to understand. ‘Mean glucose’ also known as ‘average glucose’, is self-explanatory.
The ‘glucose management indicator’ (GMI) or ‘estimated HbA1c’ (eHbA1c) is a fictional HbA1c value based on mean glucose values. It is an approach to estimate real HbA1c, which describes the history of glucose values over the past 8-12 weeks by means of measured glucose values. However, the real laboratory HbA1c can be influenced by the lifespan of red blood cells or glucose-hemoglobin-binding.
In order to get an idea of glucose concentration excursions, ‘glycemic variability’ (CV) is a valuable parameter calculated by the standard deviation of all glucose values divided by the average glucose value.
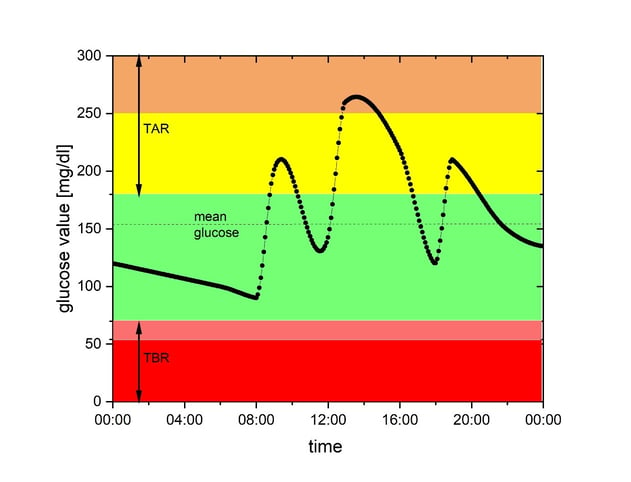
Further parameters describe different glucose ranges. Most glucose values measured with a CGM should be in the target range, called ‘time in range’ (TIR) (green area in the figure above). The target glucose range defined by an international panel of experts is between 70 mg/dL and 180 mg/dL. This target range was defined for persons with diabetes without higher risks or older age. Also in pregnancy, the target glucose range is defined slightly differently.
Glucose values below the lower glucose target range are summarized in the metric ‘time below range’ (TBR). This metric describes the percentage of time spent in hypoglycemia. TBR is separated in levels due to different clinical relevance of the glucose measurement. Level 1 is the percentage of CGM values below 70 mg/dL (low, shown in light red in the figure above), whereas level 2 (very low, darker red area in the figure above) contains all values below 54 mg/dL. The beginning of a hypoglycemic event is deemed to have occurred when CGM readings are below the threshold for time in range for about 15 minutes. The end of this event is reached when readings are back above 70 mg/dL for 15 minutes. ‘Time above range’ (TAR) is also divided into two levels. Measurements above 180 mg/dL constitute level 1 (high, yellow area in the figure above), glucose values higher than 250 mg/dL are in level 2 (very high, shown in orange).
Recommended target values
The optimal sampling duration was investigated in a clinical study to determine long-term glycemic control [3]. A greater than 70% usage of CGM over 14 days is recommended for a reliable calculation of CGM metrics.
The fairly well known metrics ‘mean glucose’ and ‘GMI’ (estimated HbA1c) should be as low as possible. The the lowering of ‘mean glucose’ and ‘GMI’ must not be at the cost of hypoglycemic events, which are a major risk in diabetes management. Therefore, recommended targets for ‘TBR’ are very tight. Maximum ‘TBR’ level 1 (glucose values below 70 mg/dL) should not exceed one hour per day, equal to less than 4% of time. Values in ‘TBR’ level 2 have to be minimized, resulting in less than 1% of values below 54 mg/dL.
‘Glycemic variability’ is an indicator for hypoglycemic excursion as bigger amplitudes in glucose values lead to higher CVs. Therefore, stable glucose levels are defined as a CV < 36%.
‘TIR’ is a key CGM metric, as studies have shown that each 5% increase is associated with clinically significant benefits [4]. Good glucose control is reached when ‘TIR’ is above 70%, which means more than 16:48 hours of a day were spent in target range. Good ‘TIR’ can only be achieved if ‘TAR’ is controlled. Therefore, ‘TAR’ level 1 has to be lower than 25% (less than 6 hours per day) and ‘TAR’ level 2 should not exceed 5% (less than 1:12 hours per day).
Summary
Different metrics are published to manage and interpret the large amount of CGM data. An international panel of experts selected important parameters to guide patients and health care professionals and recommended the following targets:
|
CGM Metric |
Recommended targets |
|
Number of days CGM worn |
14 days |
|
Percentage of time CGM is active |
≥ 70% of data from 14 days |
|
Mean glucose |
As low as possible without increasing TBR |
|
GMI |
As low as possible without increasing TBR |
|
Glycemic variability (%CV) |
≤ 36% |
|
TAR level 2 |
< 5% |
|
TAR level 1 |
< 25% |
|
TIR |
> 70% |
|
TBR level 1 |
< 4% |
|
TBR level 2 |
< 1% |
Read more about our expertise in testing medical technology: Insulin pump development and design, artificial pancreas study and the AP@home project, glucose monitoring.