The glucose clamp is a method for the determination of pharmacokinetic and pharmacodynamic (PK/PD) effects of anti-diabetic drugs (e.g. insulin) where the blood glucose (BG) concentration lowering effect is antagonized by variable glucose infusion rates (GIR).
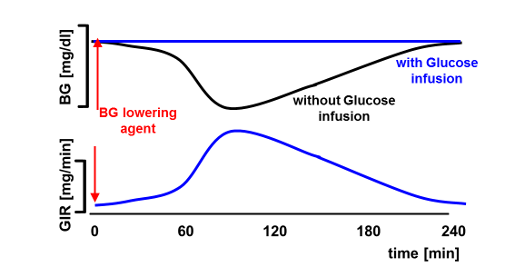
In contrast to manual glucose clamps where BG is usually measured every 5-10 minutes, automated glucose clamps allow for a continuous determination of BG and more frequent (usually minute-by-minute) adaptation of GIR which should translate into a higher clamp quality [1] (i.e., less variation of BG [higher “precision”] and less deviation from the BG clamp target [“control deviation”]). However, this is only true if there are no technical downtimes and, in particular, an undisturbed flow of blood to the glucose sensor of the clamp device. As tubes with small diameters are used to pump the blood to the glucose sensor, artefacts like clotting can lead to technical downtimes of several minutes without BG measurements being available. As shown previously [2] technical downtime of more than 5% of the duration of the experiment has a significant impact on GIR and PD results. However, the impact of downtime might also be dependent on when it occurs (e.g. downtime around tGIRmax might have a greater impact than downtime at the end of the clamp).
We therefore investigated the relationship of technical downtime with glucose clamp quality and with clamp results. We used 'total area under the curve‘ (AUC), 'maximum GIR‘ (GIRmax) and 'time to maximum GIR‘ (tGIRmax) as main outcome parameters as specified in the guidelines of the European Medicines Agency [3] for biosimilar insulins. Precision and control deviation were used as glucose clamp quality parameters as described previously [1].
Objective
In an optimal automated glucose clamp BG is measured continuously and GIR is adapted every minute. So far there has been no standard analysis describing the impact of technical downtime on PD results.
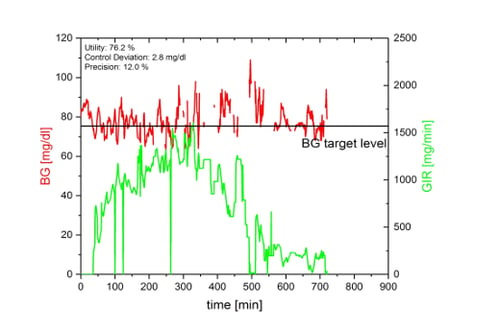
Technical downtime is expressed as ‘utility’, i.e. the percentage of time with intact automatization. A ‘utility’ below 90% might affect both tGIRmax and GIRmax [2], so that in general ‘utility’ should be greater than 90%.
The figure below shows an automated glucose clamp with a very low ‘utility‘ of only 76.2%. Despite this low ‘utility’ the GIR-curve shows a clearly recognizable and quite undisturbed profile indicating that ‘utility’ alone is not an appropriate parameter to assess glucose clamp quality. We therefore did additional simulations to assess the impact of technical downtime on both (BG-based) clamp quality parameters and (GIR-based) PD parameters.
Numerical simulations
We used a single compartment model to perform numerical simulations. The blood glucose lowering effect was induced by three different insulin profiles obtained from clinical trials. Technical downtime was simulated by stopping the automated adaptation of the GIR. However, BG changes were calculated every minute as the simulated BG-lowering effect of the different simulated insulins continued. Different durations of downtimes and different starts of downtimes were simulated.
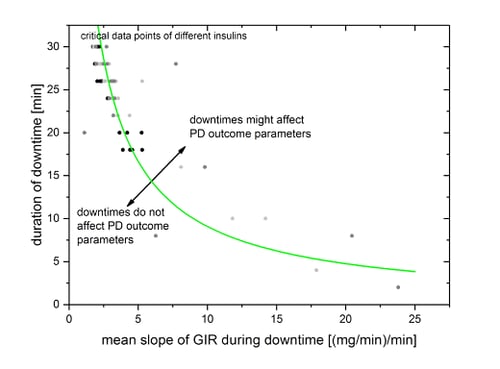
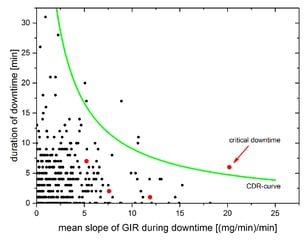
For each downtime leading to high deviations between BG and target level, corresponding mean absolute slopes of smoothed GIR-curve during downtime were calculated.
Reliability of calculated PD outcome parameters might be affected by high deviations of more than 20% between BG and target level. All simulated data points with critical deviations were collected in the figure below and fitted via a nonlinear fit.
Results
The clamp-downtime-rating-curve (CDR-curve), shown in the figure above, which combines the duration of downtime with the mean slope of GIR during downtime, was applied to all technical downtimes that occurred in an automated glucose clamp study with 26 subjects participating in two clamps each (37492 minutes of automated clamp data). Overall, 367 technical downtimes were identified with a total downtime of 1965 minutes with downtime periods between 1 and 32 minutes. Of these, the CDR-curve identified 6 periods (1.6%) between 7 and 20 minutes as critical, i.e. potentially affecting PD outcome parameters.
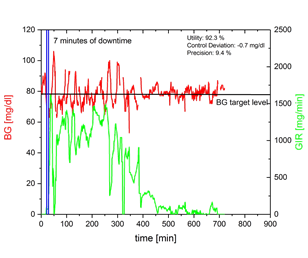
Red dots in the following right figure are the downtime periods of the example shown on the left side. The 7 minutes downtime at the beginning of the example (red dot above the CDR-curve right bottom) was identified as being critical for a reliable determination of PD parameters. Every other downtime has no influence on statistical results.
Conclusion and Outlook
The impact of technical downtime on PD parameters depends on both the duration of downtime periods and the slope of the GIR-curve during downtime. We therefore developed a clamp-downtime-rating-curve (CDR-curve) that allows the objective assessment of the impact of individual downtime periods on PD outcome parameters.
Applying the CDR-curve to a conducted glucose clamp study with prandial insulins showed that only a small number of technical downtime periods (1.6% of all periods) might affect PD parameters.


