


Many different approaches are available for measuring Pancreatic ß-cell function (BCF). The choice of testing methodology will ultimately be determined by the research question.
Metabolic dysfunction in pre-diabetes and type 2 diabetes (T2D) leads to a decline in insulin sensitivity (IS) [capacity for glucose disposal and ability to suppress hepatic glucose production in response to insulin]. As an appropriate physiological response, insulin secretion increases in a compensatory manner. Circulating insulin concentrations are reciprocally related to IS through a hyperbolic relationship and are expressed as the “disposition index” [DI: IS * first phase (acute) insulin secretion], which was shown to be highly related to the conversion to T2D [[1]] [[2]] (Figure 1).
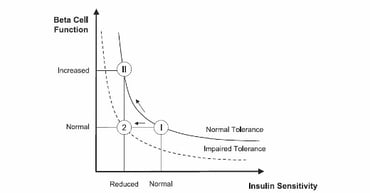
Figure 1: Disposition index: product of ß-cell responsively and IS are assumed to be a constant. A normal subject reacts to impaired IS by increasing ß-cell responsively (state II), whereas a subject with impaired tolerance does not (state 2) modified from [[3]].
First phase insulin/C-peptide response consists of a rapid and transient release of insulin occurring within the first 10min in response to an acute increase of glucose concentration. The first-phase insulin response is blunted in people with pre-diabetes and absent in T2D. The second-phase insulin response starts concurrently with first-phase response and reaches a slow and sustained plateau at 2h. With the progression of BC-dysfunction the second phase response declines over time (Figure 2).
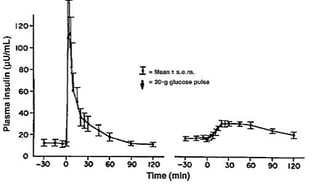
Figure 2: First Phase and second phase insulin response in a healthy subject and in a subject with T2D (blue line) after an IV glucose bolus modified from [[4]].
If we focus on technical limitations and participant burden; there are quite difficult experimental methods which require highly frequent blood sampling and professional expertise and may mainly be used in early phase clinical trials involving small groups of participants.
To adjust the β-cell response appropriately for the prevailing insulin sensitivity, a concurrent measure of insulin sensitivity is required [[5]]. Both insulin sensitivity and beta cell function can be addressed by connecting different clamp approaches and methods in series as follows:
- Hyperinsulinaemic euglycaemic glucose clamp [[6]],
- Hyperglycemic clamp without insulin infusion,
- Arginine stimulation test (AST).
Hyperinsulinaemic-euglycaemic clamp
The hyperinsulinaemic-euglycaemic clamp is the gold-standard method for the assessment systemic IS during a steady-state concentration of insulin [[7]] [[8]]. This method measures insulin stimulated glucose disposal rate (M value) and M value corrected for steady-state insulin concentrations at steady state (M/I). This technique provides reliable measurements of IS in subjects across a wide range of BCF, independent of insulin production and release. A protocol which uses a combined 2 step i.v. insulin infusion with i.v. infusion can distinguish between hepatic and peripheral IS [[9]].
During the hyperglycaemic clamp exogenous glucose infusion is used to achieve a pre-specified target glucose concentration, allowing a clear separation of first- and second phase insulin response and modelling of insulin action. The methodology provides an indirect measure of IS using the adjusted (endogenous insulin/C-peptide) rate of glucose disposal at steady state conditions with adjustments for achieved variation in glucose concentration and for urinary glucose loss. Poor late-phase insulin release may limit accuracy of measurement of insulin sensitivity. The hyperglycaemic clamp methodology provides an accurate assessment of the progressive BC-dysfunction [[10]], the effects of pharmacological interventions, as well as weight loss and bariatric surgery interventions [[11]].
Arginine Stimulation Test
During AST (arginine stimulation test) L-arginine is infused as a bolus while the participant is at a hyperglycaemic level and may be combined with several methods such as clamp assessments, IVGTT and mixed meal tolerance test (MMTT). This test provides a measure of near maximal insulin secretion (insulin secretory reserve). As arginine also stimulates glucagon release, this approach can also be used to measure α-cell function [[12]]. Individuals with blunted or absent first-phase insulin/C-peptide response maintain a reduced response to arginine.
The GGIT (graded glucose infusion test) targets a series of pre-specified progressively increasing glucose infusion rates, enabling the measurement of insulin secretion over a range of glucose levels [4]. The new Rate of Change (RoC)-software of our ClampArt® device offers the option to use precise and automatically controlled blood glucose change rates for rising BG targets [[13]].
The IVGTT (intravenous glucose tolerance test) investigates the response to an i.v. bolus injection of glucose with minimal model analysis and concomitantly quantifies pancreatic responsiveness and IS [[14]][[15]]. The insulin-modified protocol is intended to characterize insulin-dependent glucose disappearance where endogenous production is not sufficient. [[16]]. C-peptide modelling provides the assessment of second-phase insulin response. In the setting of low insulin secretion and low IS the IVGTT methodology is less reliable at providing accurate results than the hyperglycaemic clamp. However, the relative contributions of glucose uptake versus hepatic glucose output effects were comparable between hyperglycaemic clamp and IVGTT approach [[17]].
Other methods
The following methods pose fewer burdens on technical and methodological feasibility and may be performed in large groups of participants.
Due to relatively late appearance of glucose in the circulation after intake of OGTT (oral glucose tolerance test) or MMTT the strict separation of first and second-phase insulin response is blurred. Compared to methods such as IVGTT, hyperglycaemic clamp and GGIT, intake of OGTT/MMTT include the physiological contributions of the gut-hormones-pancreas (incretin) axis in the measurement of BC-response. The OGTT/MMTT is a simple method widely accepted in the evaluation of the pathophysiological progression of BC-dysfunction, but depending on many factors like gastric emptying or volume of OGTT solution. Minimal model methodologies, which require special software and expertise, have been developed to assess insulin response and IS (extended OGTT, MMTT) [3]. A solid MMTT more closely reproduces the normal physiologic state and provides data of nutritional relevance. The standardized MMTT and AST can provide reliable and reproducible measures of BCF for use in longitudinal intervention studies [[18]].

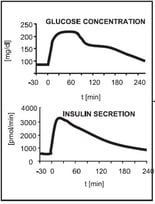
Figure 3: Qualitative glucose stimulus and insulin secretion responses from an IVGTT (left) and an OGTT (right) modified to [3]
The HOMA method provides estimates of basal β-cell function (HOMA-%ß) and insulin sensitivity (HOMA-IR) [[19]][[20]]. For any individual, fasting observation of plasma glucose and insulin may be entered in the grid and an estimated BCF and IR obtained (online calculator available) (Figure 3). HOMA %β showed weaker correlations with direct measures of BCF in progressive dysglycaemia and diabetes. It should be recognized that HOMA is a measure of basal insulin sensitivity and BCF and, in contrast to clamps, is not intended to give information about the stimulated state, whereas OGTT/MMTT yield measures of dynamic insulin secretion and insulin sensitivity over the middle of the physiological range [[21]]. Applying the HOMA model may be more convenient and simple and has been widely used in large epidemiological studies, but the results are less reliable for the detection of changes in BCF and should not be used as the only tools for the assessment of pancreatic reserve [[22]][3][5].
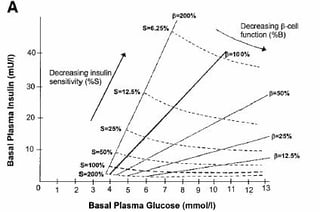
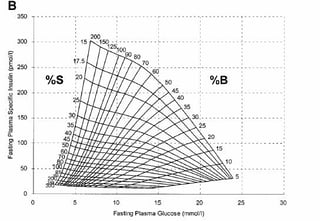
Figure 4: HOMA was published by Prof D.R Matthews in 1985 [19] (A) HOMA2 was established in 1998 [20] (B).
Our scientific excellence will help you to select the most effective approach taking into consideration relevant physiology as well as methodological and feasibility considerations. Our knowledge is key for optimally designing and conducting your testing methodology.
References
[1] Lorenzo C; et al, Disposition Index, Glucose Effectiveness and Conversion to T2D. Diabetes Care 2010;3:2098-2103
[2] Sjaarda L, et al. Measuring ß-cell Function Relative to Insulin Sensitivity in Youth. Diabetes Care. 2013;Vol 36:1607-12
[3] Cobelli C, et al. Assessment of beta-cell function in humans, simultaneously with insulin sensitivity and hepatic extraction, from intravenous and oral glucose tests. Am J Physiol Endocrinol Metab. 2007;293:E1–15
[4] Hannon TS et al. Profound defects in ß-cell function in screen-detected T2D are not improved with glucose lowering treatment in the early diabetes prevention program (EDIP). Diabetes Metab Res Rev. 2014:30:767-776
[5] Cersosimo E, et al. Assessment of Pancreatic ß-cell Function: Review of Methods and Clinical Applications. Current Diabetes Reviews;2014,10:2-42
[6] Schliess F. Blog: Glucose Clamps Part 1. 2 steps towards insulin sensitivity adjusted for glucose effectiveness
[7] DeFronzo RA, et al. Glucose clamp technique: a method for quantifying insulin secretion and resistance. Am J Physiol. 1979;237:E214-E223
[8] Heise T, et al. Euglycemic glucose clamp: what it can and cannot do, and how to do it. Diabetes, Obesity and Metabolism 106;18(10):962-972
[9] Schliess F. Blog: Glucose Clamps Part 2. 2 steps towards towards hepatic and peripheral insulin sensitivity.
[10] Sjaarda L, et al. Measuring ß-cell Function Relative to Insulin Sensitivity in Youth. Diabetes Care. 2013;Vol 36:1607-12
[11] Martinussen C, et al. Immediate enhancement of first-phase insulin secretion and unchanged glucose effectiveness in patients with T2D after Roux-en-Y gastric bypass. AM J Physiol Endocrinol Metab. 2015;308:E535-E544
[12] Robertson RP, et al. Beta Cell Project Team of the Foundation for the NIH biomarker Consortium. Arginine is preferred to glucagon for stimulation testing of beta-cell function. AM J Physiol Endocrinol Metab.1014;307:E720-E727
[13] Benesch C Blog: A different design of Glucose Clamps: Fixed Rate of Blood Glucose Change rather than Fixed Blood Glucose Levels
[14] Bergman RN, et al. Physiologic evaluation of factors controlling glucose tolerance in man. Measurement of insulin sensitivity and ß-cell glucose sensitivity from the response to intravenous glucose. J Clin Invest. 1981;68:1456-67
[15] Bergman RN. Lilly lecture 1989: Towards physiological understanding of glucose tolerance: minimal-model approach. Diabetes. 1989;38:1512-27
[16] Prigeon RL, et al. The effect of insulin dose on the measurement of insulin sensitivity by minimal model technique. Evidence for saturable insulin transport in humans. 1996;97: 501-507
[17] Ader M, et al. Glucose Effectiveness Assessed under Dynamic and Steady State Conditions. J Clin Invest.1997;99:1187-99
[18] Shankar SS, et al. Standardized Mixed-Meal Tolerance and Arigine Stimulation Tests Provide Reproducible an Complementary Measures of ß-cell Function: Results From the Foundation for the National Institutes of Health Biomarker Consortium Investigative Series. Diabetes Care.2016; 1-12
[19] Matthews DR, et al. Homeostasis model assessment: insulin resistance and ß-cell function from fasting plasma glucose and insulin concentrations in man. Diabetologia. 1985;28:412-419
[20] Levy JC, et al. Correct homeostasis model assessment (HOMA) evaluation uses the computer program. Diabetes Care. 1998;21:2191-2192
[21] Wallace TM, et al. Use and Abuse of HOMA Modeling. Diabetes Care. 2014;27:1487-95
[22] Hermans MP, et al. Comparisons of tests of beta-cell function across a range of glucose tolerance from normal to diabetes. Diabetes. 1999;48:1779-86