The performance of blood glucose (BG) meter can be described by analytical accuracy or clinical accuracy. Analytical accuracy describes the difference between BG values from BG meter being evaluated and BG values obtained with a reference method. A typical tool for analytical accuracy is linear regression and typical measures include the coefficient of correlation (precision and bias) and percentage deviations. These measures are unsuitable to describe clinical accuracy as they cannot identify important outliers and the clinical consequence of treatment decisions based on BG meters with percentage deviations strongly depends on the BG level. While analytical accuracy is a quantitative method, clinical accuracy is a qualitative method for describing BG meter accuracy. Results of treatment decisions were judged based on differences between the BG meter values and the true BG value. The widely accepted tool for clinical accuracy is the error grid analysis.
For the error grid analysis paired results from both the BG meter and the reference method were plotted on the so-called error grid. Typically a set of risk zones are then superimposed on that graph. Each of the zones represents a degree of risk of an adverse outcome due to the error in measured BG values. The analysis of an error grid is the determination of the percentage of data points that fall into each zone of clinical outcome.
Three different error grids of three different decades with different borders of the zones are used in clinical literature.
Clarke Error Grid [1]
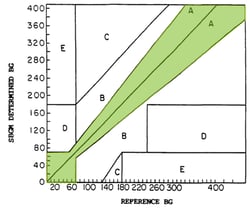
The Clarke Error Grid was introduced in 1987 by five experts of the University of Virginia and was based on clinical practise. All experts judged the same scenario: A target range for the BG values of the patients was set to 70 – 180mg/dl. Within this range the patients are well controlled, below or above this range the patients have to intervene with corrective actions. A correction that results in a BG value outside the target range was considered as inappropriate as well as the failure to treat a BG value outside range. The judgement of the experts leads to an error grid with five different zones called zone A to E.
Zone A is the zone on both sides of the diagonal. The shape of the zone results from the judgement that a difference between BG meter values and reference BG values of less than 20% or BG values as well as reference values are in the hypoglycaemic range (< 70mg/dl) lead to clinically correct decisions by the users.
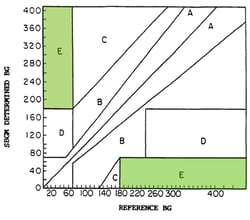
On the other side of the scale it is very dangerous if the values measured with the BG meter will trigger the opposite of the correct decision necessary to treat the true BG value measured by the reference method. If the BG meter measures BG values above 180mg/dl but the reference value is below 70mg/dl, the ‘correction’ based on the meter values is an insulin bolus. This would be the wrong decision and would drive the patient further into the hypoglycaemic range (upper left zone E). If the BG meter values are below 70mg/dl and the true BG is above 180mg/dl it is clinically the opposite decision raise BG instead of adjusting insulin (lower right zone E).
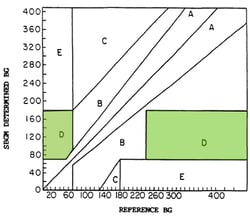
 Zone D is the zone with BG meter values in the target range of 70 to 180mg/dl but with reference values below 70mg/dl or above 180mg/dl. Based on the BG meter values a correction is not necessary but based on the true values of the reference method a correction is needed, especially in the hypoglycaemic range. In Zone D the necessary corrections are not triggered by the BG meter values.
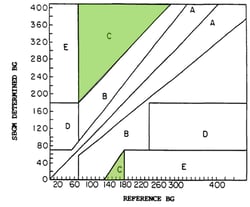
The opposite is true for zone C where the true value is more than 100mg/dl below the BG meter value for BG meter values above 180mg/dl (upper C). A second, very small zone C (lower C) contains all BG values in the hypoglycaemic range with corresponding reference values between 130 and 180mg/dl. In both zones the BG-values leads to over-corrections, a correction with a too large dose of insulin in upper C and a too large correction to raise BG in lower C.
In the remaining zone B the difference between BG meter and reference values is larger than 20% and the resulting clinical decisions are not correct (zone A) but uncritical.
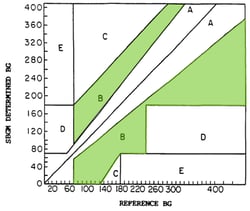
This leads to the five different zones of the Clark-Error Grid:
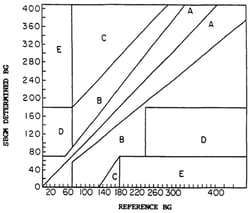
- A: Clinically correct decisions
- B: Clinically uncritical decisions
- C: Overcorrection
- D: Skip a necessary correction
- E: Performing the opposite/wrong “correction”
Parkes Error Grid [2]
Despite the great usefulness and the wide acceptance of the Clark Error Grid there was some criticism as well, mainly
- the Clark Error Grid was introduced only by a small number of experts
- there are discontinuous transitions between zones (e.g. a direct transition between zone B and zone E skipping zones C and D).
- The Clark Error Grid does not differentiate between type 1 and type 2 diabetes
This all leads to another definition of the five zones of the Error Grid 13 years later: At the annual meeting of the American Diabetes Association (ADA) in 1994,100 physicians were asked to judge the borders for the five risk zones (0 to 4) separately for type 1 and type 2 diabetes patients. The two times 100 individual Error Grids were evaluated and mean values of the risk zones were calculated from 0 to 550mg/dl in steps of 10mg/dl with smoothed borders. The results are the Parkes Error Grids or Consensus Error Grids for patients with type 1 diabetes (A) and type 2 diabetes (B).
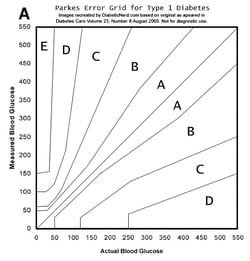
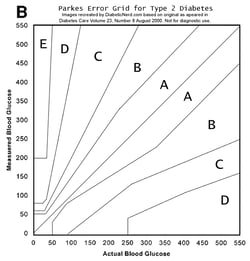
The differences between the two grids are very small. Zone A is a little bit tighter and zone B a little bit wider for patients with type 1 diabetes. The borders between zone B/C and zone C/D are very similar.
In comparison with the Clark Error Grid the Parkes Error Grid has continuous transitions between the zones, a larger range up to 550mg/dl and no lower zone E.
Surveillance Error Grid [3]
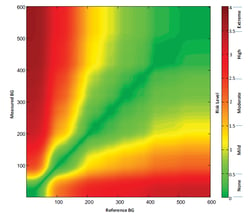
In 2014 the Surveillance Error Grid was introduced by a number of authors from academia, industry and regulatory agencies. The main reason for the development of a new error grid was the change in clinical and technological standards. In the new error grid the outcomes of the Diabetes Control and Complications (DCCT) trial [4] are considered as well as new insulin analogues and higher expectations of the new BG meters on the market.
A survey was initiated by the error grid panel among 206 clinicians and 28 non-clinicians. Each of them had to judge two out of the following four scenarios:
- Patients with type 1 diabetes on insulin pump therapy
- Pateints with type 2 diabetes on insulin injection therapy
- Pateints with type 2 diabetes without insulin therapy
- Patients with type 1 diabetes using a continuous glucose monitoring device for multiple daily insulin injections.
The specialists were asked to set BG borders for the following action depending on the true BG value (reference method) and the BG value obtained from the BG meter.
- A: Emergency treatment due to low BG
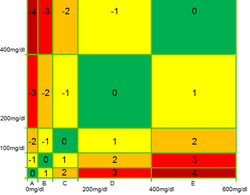
- B: Oral glucose intake
- C: no action needed
- D: administration of insulin (or exercise and lower carb intake in scenario 3)
- E: Emergency treatment due to high BG
As a consequence each of the 234 specialists came up with his individual five times five error grid with personally defined boundaries between the five zones.
All these individual error grids were then merged into the Surveillance Error Grid were the different zones are indicated with different colours from green for no risk to red for extreme risk of hypoglycaemia or hyperglycaemia. No differences between clinicians and non-clinicians were found but differences between US and non-US specialists. Scenario 3 was judged slightly different but at the end after some smoothing the Error Grid panel published a final single error Grid.
Conclusion
The clinical accuracy of BG meters can be analysed with the described Error Grids. If i) the number of paired data points is sufficient, ii) the reference method has a high analytical accuracy, iii) different lots of test strips for the BG meters are used and iv) the data points are spread throughout the entire range of the error grids, the distribution of data points is an easy and at the same time very powerful method for the post-market surveillance of BG meters.
Profil offers the analysis of BG meters using various error grid approaches. If you are interested in this method we recommend you get in contact with us to discuss next steps.
References
[1] Clarke WL, Cox D, Gonder-Frederick LA, Carter W, Pohl SL. Evaluating clinical accuracy of systems for self-monitoring of blood glucose. Diabetes Care. 1987; 10(5):622-8.
[2] Parkes JL, Slatin SL, Pardo S, Ginsberg BH. A new consensus error grid to evaluate the clinical significance of inaccuracies in the measurement of blood glucose. Diabetes Care. 2000; 23(8):1143-8.
[3] Klonoff DC, Lias C, Vigersky R, Clarke W, Parkes JL, Sacks DB, Kirkman MS, Kovatchev B; Error Grid Panel. The surveillance error grid. J Diabetes Sci Technol. 2014; 8(4):658-72.
[4] The DCCT Research Group. Diabetes Control and Complications Trial (DCCT). Diabetes Care 1987; 10(1):1-19.


